A patent family is an unparalleled fortress, strategically safeguarding intellectual property across multiple jurisdictions. It forms a robust defense, enabling swift and global protection against unauthorized use of innovative concepts.
However, understanding global patent portfolios is complex and exhaustive. Navigating these connections across borders becomes challenging. Imagine simplifying this process with a visual map that traces an invention’s journey across countries, unveiling insights concealed in conventional patent listings—a more efficient approach.
Enters, Patent Family Tree.
This article concerns an often overlooked but essential part of patents- their families. And how visualizing it can save you a ton of time and money! But before we dive in, it’s essential to understand the categorization of patent families and how they work.
Two significant categories of patent family
1. Simple Patent Families
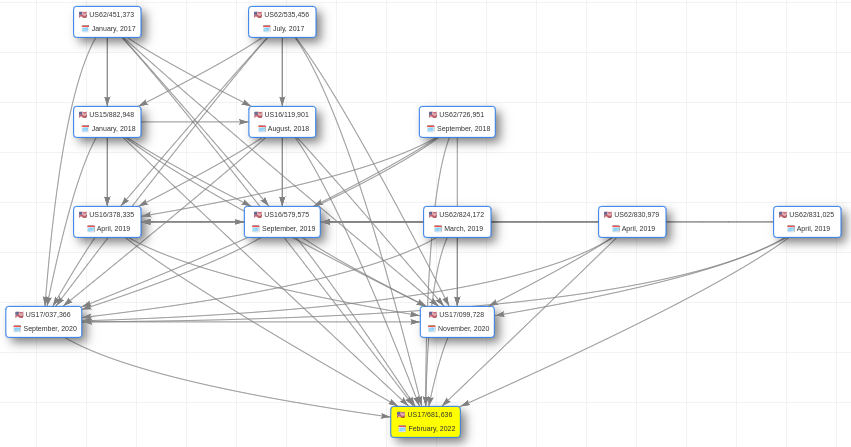
A simple patent family is like a group of brothers and sisters having a different name (or, in the case of patents, filed in different countries), but they all belong to the same family (or protect the same invention). Like siblings who share common parents, patents in a simple family share the same core invention but might have slight differences based on the requirements of each country’s patent office. The representation of such families would look something like this-
2. Extended Patent Families
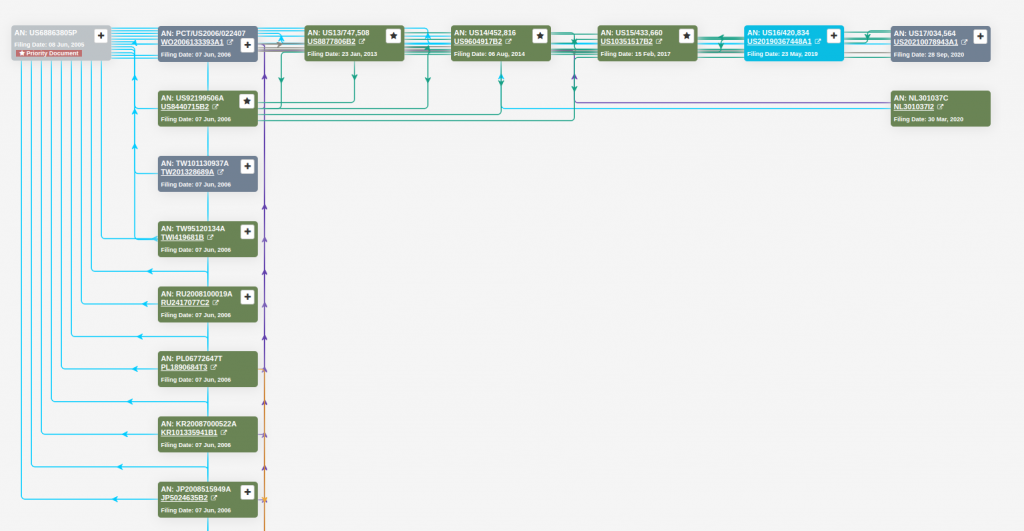
An extended patent family is like a big family tree of related inventions, as represented in the image below. These patents cover similar technologies, but they might not be precisely the same. What makes them part of the same family is that they all share at least one common idea or priority with another family member, directly or indirectly. As shown in the image below, it extends into different branches of the same family tree stemming from a common trunk (or idea) but growing in slightly different directions. This concept helps inventors and researchers understand the broader landscape of related technologies and innovations in a specific field.
Visualizing a Patent Family Tree
While patent families are often depicted in tables listing related filings or described textually, visualizing the connections as a tree or network graph can provide additional insights.
Graphical representations of patent families illustrate the relationships in an intuitive, easily digestible way. The priority application or parent patent forms the root node, with subsequent filings in the US states shown as child nodes branching off the root.
Beyond basic tree diagrams, more advanced graphical techniques can convey additional patent family information. The node’s color, size, and shape can encode filing dates, jurisdictions, status, and other attributes. Interactive features allow drilling down into the data underlying each node.
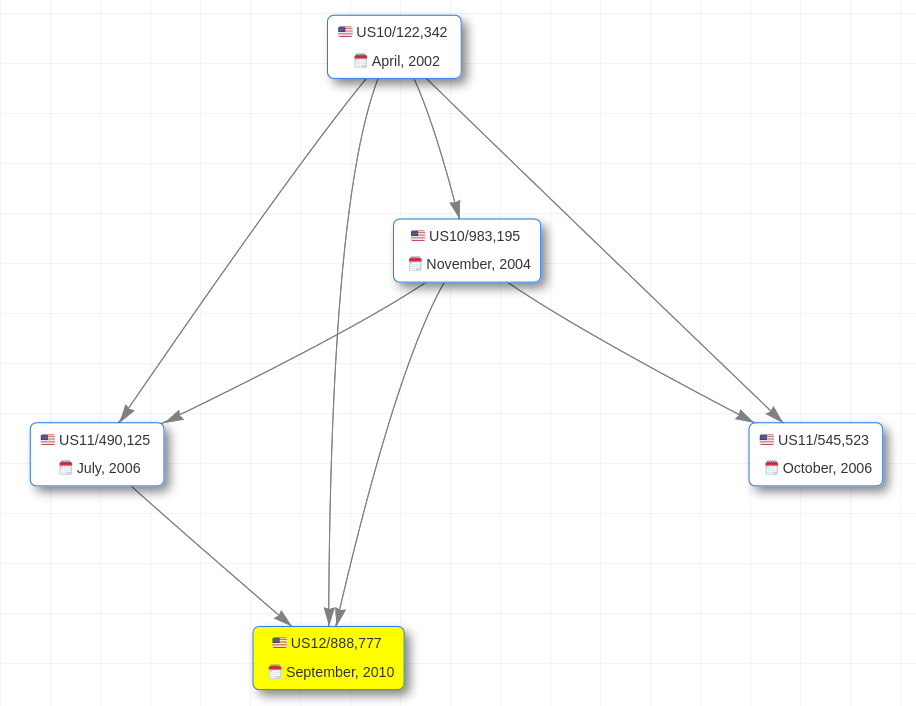
The graphical representation of patent families deserves more focus and exploration because it has the potential to enhance our understanding of inventions and their global impact over time. So, we created a Patent Family tree interface-
Graphical representation of patent family tree
The interactive visualizations distinctly color-code the node representing the subject patent. This lets you see the focal patent and how other applications are directly or indirectly connected.
Simply click any node to access extensive bibliographic details, including application number, publication/patent number, filing date, inventors, assignees, and a downloadable PDF.
Its intuitive and dynamic interface enables users to seamlessly explore the details of each patent in a family tree. You can rapidly analyze relationships, identify key contributors, and access complete patent content.
With interactive color coding and in-depth patent details at your fingertips, you can more easily extract valuable insights from patent family connections, parent applications, child applications, direct continuity applications, etc.
What insights emerge from this visual mapping of the patent family tree?
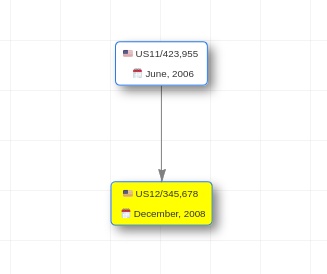
The initial non-provisional patent application submitted for an invention is known as a parent application, which might encompass multiple inventions. Subsequent applications, referred to as child applications, are filed based on this parent application.
This kind of visual mapping is appealing and makes the parent-child relationship easy to understand. The incoming edge from application A to application B indicates that application A is the parent application and application B is a child application.
Significant insights that can be seen in such a family tree are :
1. Company’s research focus
The structure and extent of the patent family can highlight the areas where the inventor or company has concentrated its R&D efforts, signaling strategic priorities or areas of expertise.
Let’s take an example. Apple has a patent application US09/236,513 filed in 1999 with over 350 family members across the US till now. This application is about methods that operate as hands come near, touch, and move across a flexible multi-touch surface equipped with proximity-sensing capabilities.
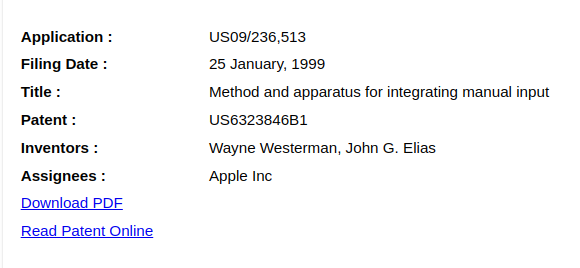
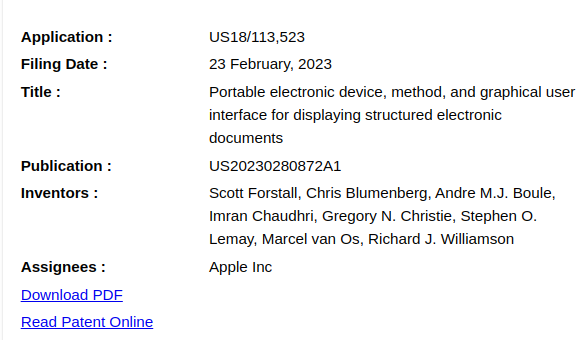
To view more about this patent family, click here
Analyzing this patent family makes it easy to understand what Apple is working on, from the touch features to portable devices for displaying structured electronic documents, as mentioned in the recent application US18/113,523 filed in 2023.
A larger patent portfolio reflects the innovation and research strength of an organization.
2. Foundational Inventions
A patent application with many child applications generally signifies that the original invention is foundational and has spawned various refinements, improvements, or new embodiments. This can easily be seen in graphical representation.
This signifies :
- Continuous Innovation: Ongoing innovation and development based on the original invention indicates active research and development efforts.
- Strategic Intellectual Property Expansion: The inventor or organization is strategically expanding their intellectual property portfolio, possibly to cover a wide range of applications, secure market position, or block competitors.
- Protection Against Competition: By filing child applications, the patent holder can prevent competitors from patenting related innovations, thus maintaining a dominant position in the relevant technology or market sector.
- Technological Impact: The invention is impactful in its field, leading to many derivative inventions or technologies.
Take the family tree shown below as an example. Application US09/305,304 concerns a “branching filter with a composite circuit of an LC circuit and a serial arm saw resonator.”
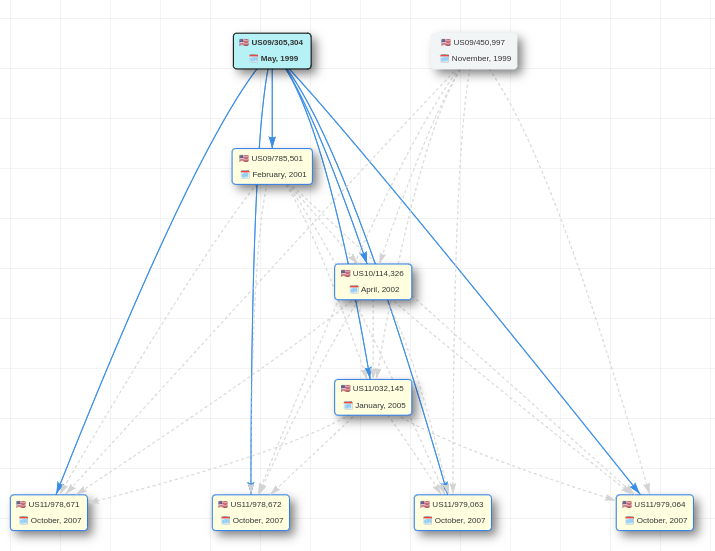
The invention pertains to a compact filtering system for mobile communication devices like portable phones. It utilizes a surface acoustic wave (SAW) resonance filter, enhancing the efficiency and functionality of communication equipment in small, mobile devices.
Later, in its child applications, refinements were made, showing continuous improvement. To safeguard against competition, the company filed patents for branching filters and the construction of branching filter packages.
3. Fair valuation of patents in licensing and partnerships
Cross-licensing allows both parties to operate in each other’s markets, avoiding potential litigation costs from enforcing patents against one another. Simultaneously, it creates new commercial opportunities that would otherwise remain blocked. Mapping out patent families provides insights into where such win-win licensing arrangements may exist between firms.
Visually mapping the family tree makes it easier to distinguish between core technological patents (central, often with many child applications) and more peripheral ones (fewer connections). Due to their fundamental nature, core technologies might be more attractive for licensing or partnerships.
For example, if Apple wants to license a camera innovation from Sony, analyzing Sony’s patents will show essential and minor improvements. This will help Apple in price negotiations and ensure a fair valuation.
When an assignee looks to sell a patent family, graphical representations can help the buyer identify the core, high-value patents within the larger family. For example, say assignee A owns a patent family of 20 members, but buyer B only wants to acquire the foundational patents. By visually inspecting the family tree, B can easily pick out the critical parent applications that spawned numerous child applications. These parents likely represent fundamental inventions that led to various refinements and modifications through child applications.
Unlike tabular listings, the graphical tree structure readily allows filtering out ancillary applications, which don’t determine core vs. peripheral family members.
4. Evolution of family
The evolution of a patent family refers to the development and expansion of a patent portfolio over time as it grows from the initial filing (or filings) to subsequent related patent applications.
Over time, parent-to-child applications have introduced or refined features.
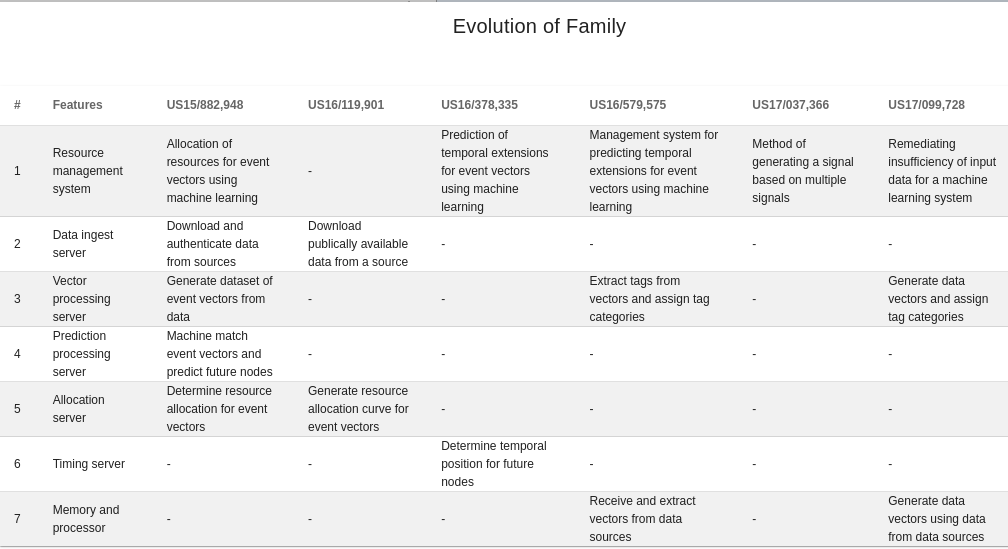
Using the image above as an example, the table format illustrates each feature’s progression and introduction from the parent to its subsequent child applications.
What insights can be taken from this?
- Innovation trajectory: Understanding how certain features evolve in subsequent patents can indicate the trajectory of technology advancements and improvements.
- R&D focus and strategy: The introduction and alteration of features likely to provide insights into the company’s strategic priorities in research and development.
- Patent value: Changes in features can signify attempts to broaden or strengthen the patent’s scope and its market exclusivity.
- Legal strategy: Evolution in features might be driven by patentability concerns, efforts to circumvent existing patents, or to strengthen claims against potential infringement.
In summary, a patent family shows how an invention is protected across different countries. Mapping the connections between related patents in a family visually can provide helpful information.
Looking at patent families may help innovators understand:
- Where research is focused on new features
- Strength of protection based on the number of countries covered
- Licensing opportunities by seeing competitors’ related patents
- Value of patents based on the size of the family
Conclusion
By visualizing patent families as graphs, important details become more evident. This allows strategic decision-making about intellectual property and your business. In a world where ideas fuel business, insights from patent family trees serve as the spark that propels the business forward, igniting innovation, protecting intellectual property, and fostering growth.
Want to find your competitor’s R&D focus and technological strength to avoid potential litigations and strategize portfolio expansion? Fill out the form below to schedule a demo of “Patent Family Tree”.
Authored By: Alok Tripathi, Product Development


