The importance of performance analysis for success in any walk of life – be it business, academia, or anything for that matter – can’t be stressed enough upon. A lot has already been written and discussed on the subject. However, there are only a handful of articles discussing how to go about it, the pre-work that you should do, and the metrics that you should take into consideration.
Thus, to bridge that gap, today we are discussing an easily replicable 4 step approach – with examples – to help you conduct a performance analysis. We use this same 4 Step approach for our performance analysis too.
Along with it, we are also sharing our internal performance on where we stand in IP monetization. You can use those numbers to benchmark yourself. Further, if you are someone who is receiving similar services from an organization, you can use our numbers to benchmark your service provider.
The Four-Step Approach to find IP Monetization Performance
Following are the metrics that you can use to figure out how good you are at something that you do:
The Number of Projects you received and their Frequency
Comparing the number of projects that you received in this quarter with the past can help you gauge how you’re doing. If there is an increase in the number of projects and their frequency, consider that as a positive signal of you doing well.
The Number of Repeat clients and their Percentage
In the second step, you have to figure out the number of projects you received from your old clients. You have to evaluate whether the number is increasing or decreasing – in terms of the total number and overall percentage as well.
For example, you have to compare the number of projects from old clients vs. new clients in this quarter vs the last quarter. You should also compare projects received from old clients with the new clients in the same quarter – current and the last.
If you’re not getting projects from your old clients regularly, then there is a chink in your armor which you have to find and fix.
Are your old clients giving you diverse projects? What is the complexity index of those projects?
In the third step, you have to figure out what kind of projects you are receiving from your existing clients. Did your client give you complex projects in the last quarter? Were all the projects of the same type when your client could have made you work on different projects?
If your existing clients are continuously giving you a particular kind of project, when they can give you different ones, then there is something wrong either from your end or from the client’s end. On the other hand, if your client made you work on different kinds of projects, you can consider that as a positive signal. It means you have won their trust.
Other than that, the complexity of projects that you received is another good indication of a client realizing your forte. You will, for sure, agree that you only assign a complex task to your best employee. Similar is the case with a client. He assigns the most complex task to the best service provider.
What was the project’s success rate?
At last, you should calculate what was the success rate of your deliverables? Did your client achieve his end objective using your services? Chances are that a client may let you know about this. Just in case he doesn’t do so, do some research from your end to figure that out.
Now to give you an example, we used these same performance metrics to check how good our Infringement Department is when it comes to IP monetization.
Where GreyB Stands in IP Monetization?
No one else but we only can judge where we stand and where we need to improve.
In today’s IP world, one has to be fast, productive, innovative, and most importantly ready to improve & upgrade from where they stand, to survival in this booming industry.
These can act as judgment criteria for the clients to make the decision on whom to trust for assistance in their IP monetization. To frame a benchmark for clients and for our self, an analysis was conducted for the projects accomplished in the IP monetization field in the second half of the year 2015.
Why?
The main aim was to check what all we have done and how successful we have been.
The ultimate goal was to record a minimum level of quality work which we deliver and provide an overview for the client to try our research work for once, rest we let our work speak for us.
While performing the analysis, various thoughts turned up in mind which assisted in carving out various aspects both from the client angle and the team angle.
The number and complexity of projects that we received
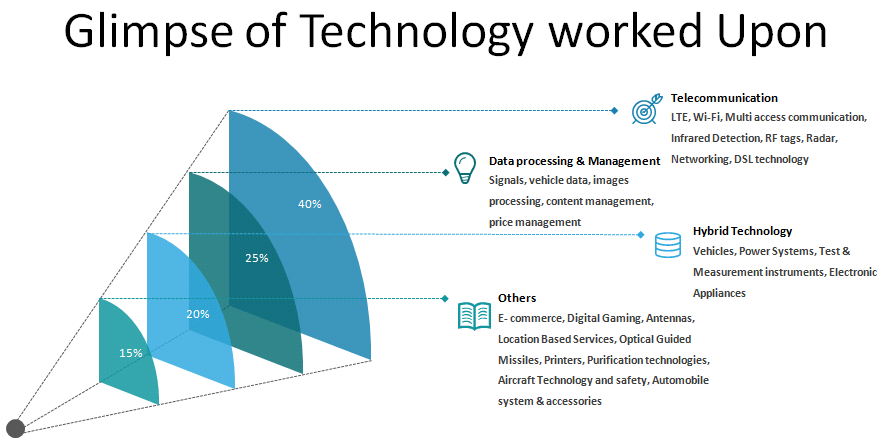
The first thing visible was the frequency of projects from various technologies. It provided an idea of the domains which are our forte and the diversity of the technologies with which we can work and train more to serve better.
The image below gives an overview of the type of technology we worked upon during the period from January 2015 to June 2015.
The Type of Projects Our Clients Made Us Work on
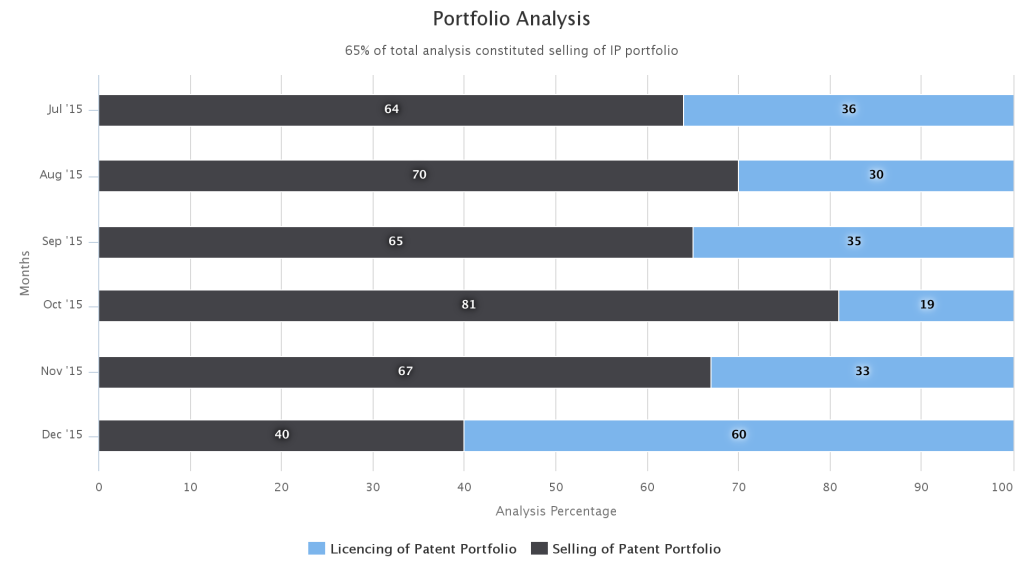
With respect to the objective of the project – litigation or monetization – the analysis revealed good insight. We received 66% of projects for patent monetization and the rest 33% were for litigation purposes.
The chart below represents the type of project we were made to work upon during the period from July 2015 to December 2015.
The Project Success Rate
The chart below represents our success rate during the second half of 2015.
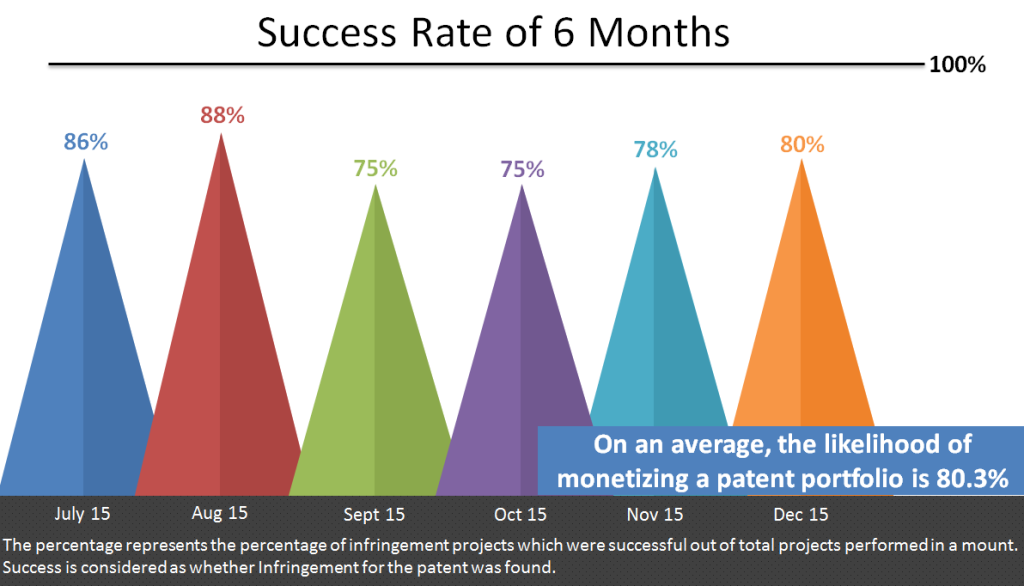
The project success rate helps evaluate the happiness index of your client and also lets you find gray areas where you need to work.
We also got to know which clients might be happy with our performance and more importantly who might not be. As Bill Gates once said, “Your most unhappy customers are your greatest source of learning”. The unhappy ones gave us a target/challenge to conquer, and we did and continue to go the last mile to meet client expectations.


